
Overview
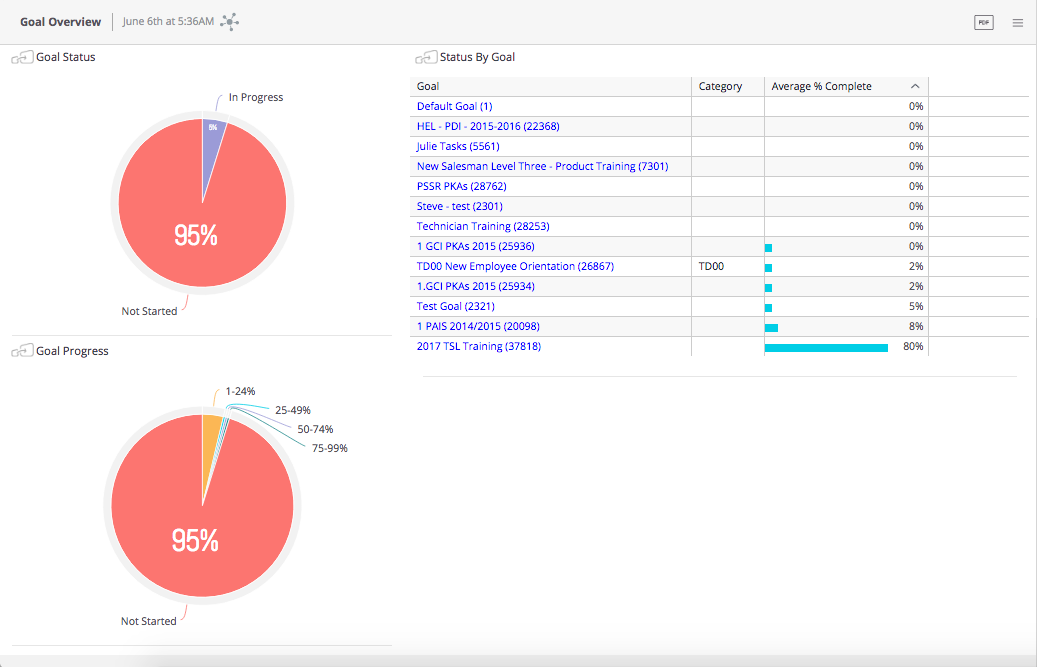
The Goal Overview Dashboard provides an overview of how the selected team is
progressing with goals assigned to their respective development plans.
Report Elements
Goal Status
For all team members who have at least one goal on their development plan, the pie
chart shows their status across all goals. So, if a user has not started any goals, they will
be in the not started section, while those who have completed all goals show in the
completed section. Others who have started at least one of the goals will appear in the
In progress section.
Goal Progress
For all team members who have at least one goal on their development plan, the pie chart shows a percentage of each in terms of progress. Each section of the pie is broken into:
- Not Started
- 0 – 24% complete
- 25 – 49% complete
- 50 – 74% complete
- 75 – 99% complete
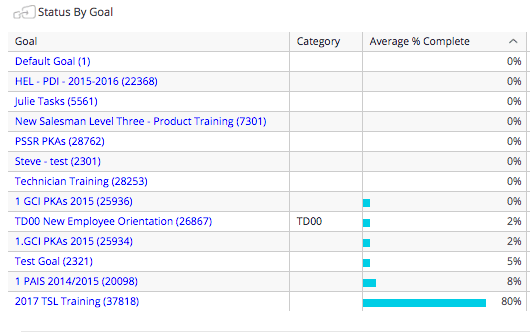
Status by Goal
This widget shows all goals associated with a goal template and are shared with others. Individually created goals will not show in this dashboard.
The table shows a bar graph of % complete for each goal. Right-clicking on the goal opens a detail view for the individual goal.
These details include:
- Goal Status
- Goal Progress
- Overdue activities
- Activities coming due
Each of these elements can be right-clicked to view their details. Depending on the detail view, additional widgets allow even further detail views.
Click anywhere outside the detail view to close the detail view.
Widgets
Visual elements on the dashboard are called widgets. There are two types of widgets used in this dashboard:
- Pie Chart Widget
- Table Grid Widget
Pie Chart Widget
A Pie Chart Widget displays data broken into pieces of the pie. Each piece represents a percentage of the whole pie. For example:
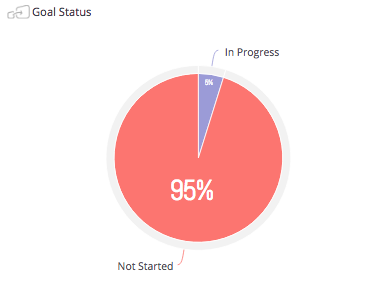
The example widget shows 5% of the total team has started at least one Goal on their development plans and 95% of the total team has not started.
If the widget has this icon in the upper-left corner  then the widget is jumpable. This means the widget can be clicked to filter other widgets on the page, or right-clicked to view the details.
Table Grid Widget
The table grid widget displays data in a table. This widget is typically used to display detail data.
If the widget has this icon in the upper-left corner  then the widget is jumpable. This means the widget can be right-clicked to view details.
Comments
0 comments
Article is closed for comments.