
Printing and Exporting Information
Overview
There are a number of export options available in different areas of the visual reporting dashboards. This document will outline the controls that access the export options, the export formats available for different types of elements, and how to download each format type.
Controls
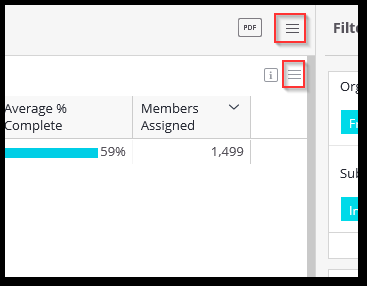
There are two areas where a user can access export options: the main page and each individual widget. In each case, the export options can be found using the menu icon, sometimes referred to as a “hamburger” icon. In some cases, like the screen capture below, there is also a shortcut to exporting the page as a PDF.
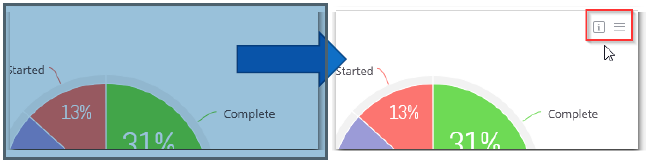
To access the menu options on each individual widget, mouse over the widget in question so that the menu appears in the upper right corner of the widget. The graphic below illustrates the widget before you move your mouse over it and then the menu that appears on hover.
Formats
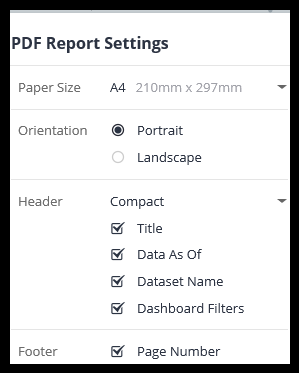
Most dashboards offer the option to download the full page as a PDF. You can either use the menu to select PDF as the download option or, if the option is available, choose the PDF shortcut. The PDF option page will open and you will be able to choose to include or exclude various screen elements.
When exporting to PDF, you also have the ability to edit the page display itself. Switch the mode in the preview window from view to edit.

Now, you can select the borders between widgets to expand or shrink each section.
Image
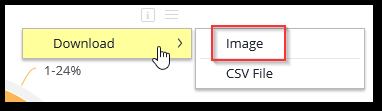
When a visual element is present on the dashboard, an option to download an image of individual widget is offered in the menu. This option is useful for including the visual image in a PowerPoint or report.
CSV
CSV is a file format that will present your data as text in a format that is easily opened with a spreadsheet, e.g. Excel, or imported to a database. The advantage of the .csv format is that when you open the data in a spreadsheet, there is no formatting applied to the data. You can then apply your own formatting as needed.
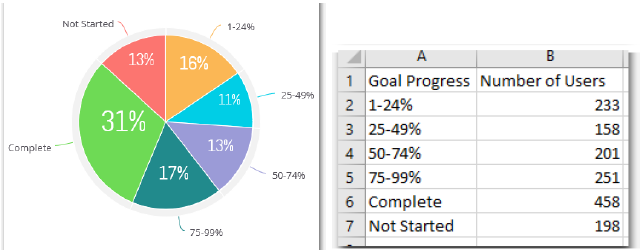
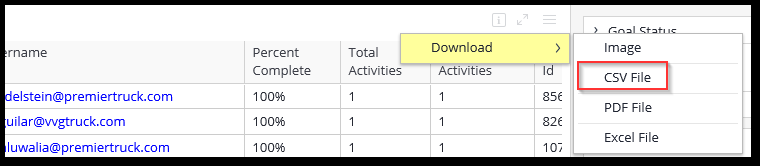
The CSV option is available for many different types of objects. When you choose to export a visual element as CSV, the visual element will be represented as numbers. For example, the image below shows a pie chart widget and the CSV export of the pie chart data.
CSV is also available when you drill down and view the details for a widget. For example, clicking View Details on a slice of a pie chart will open a drill down report displaying the details of the slice. This report can be exported using CSV.
Excel
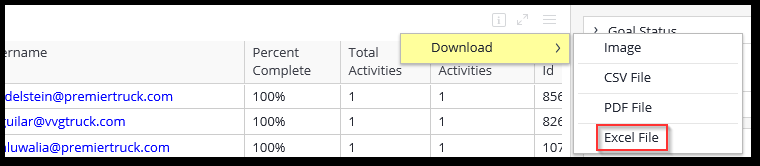
Exporting to the Excel format is similar to exporting as CSV. The primary difference between the two formats is that an Excel file is pre-formatted to display the data so that it is visually similar to the report in the dashboard itself.
Comments
0 comments
Article is closed for comments.