
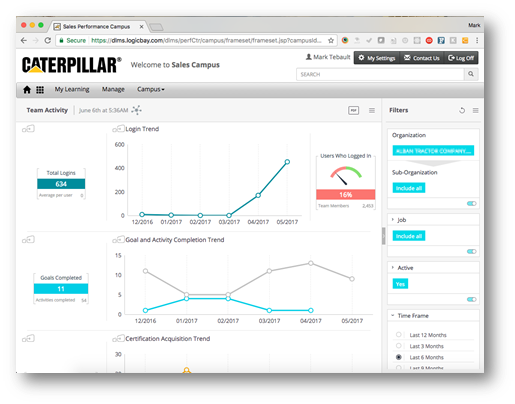
Overview
The Team Activity Dashboard provides summary and trend information on
the selected team. Data elements include:
- Login activity
- Goal activity
- Certification activity
- Curricula activity
- Class registration activity
- Asset hit activity
Widgets
Visual elements on the dashboard are called widgets. There are three types
of widgets used in this dashboard:
- Summary Widget
- Trend Graph Widget
- Meter Widget
Summary Widget
A summary widget shows a summary of information. For example:
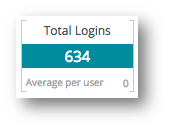
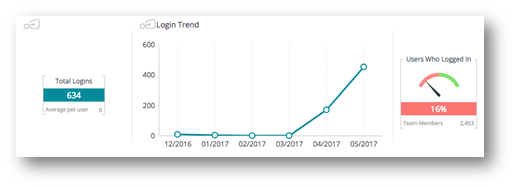
The example widget shows 634 logins for the selected team within the
selected time frame.
If the widget has this icon  in the upper-left corner then the widget is
jumpable. This means the widget can be clicked to view the details.
Trend Graph Widget
The trend graph widget shows one or more data elements over the selected
time frame.
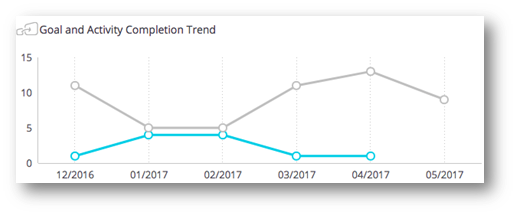
For example:
This widget shows the total number of Goals and Activities completed by the
selected team over a 6 month period.
Mouse over the data points to see values for the specific data points.
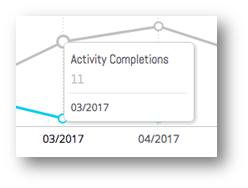
Click, or drag over a range, to filter on a date or date range. Click on the Clear Selection link to remove the filter from the widget.
Right-Click to view details.
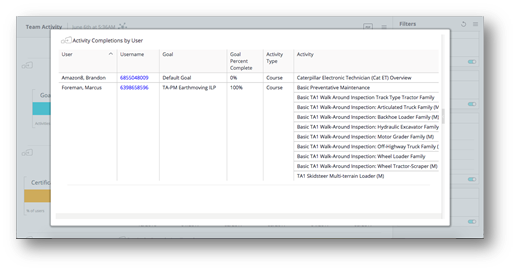
Click anywhere outside the details view to close the details view.
Meter Widget
The meter widget shows a percentage value. For example:
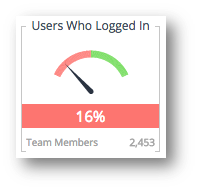
The example widget shows that 16% of the 2,453 team members have logged in within the selected time period.
Login Activity
A summary widget shows how many times team members logged in within the selected time frame. The average login per user is shown below the login total. A trend widget shows login activity over time. A meter widget shows the percentage of team members who logged in within the selected time frame.
Goal and Activity Trend
A summary widget shows a total number of Goals and Activities completed by team members within the selected time frame. A trend widget shows goal activity over time. 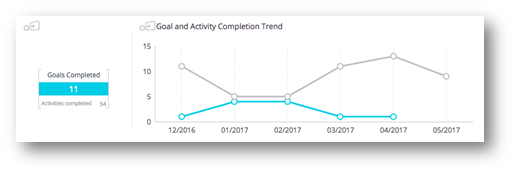
Goals refer to development plan goals. Activities refer to development plan activities.
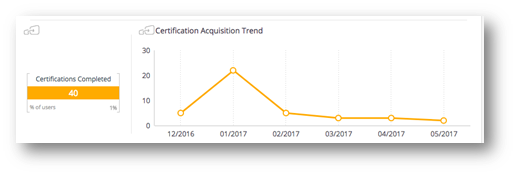
Certification Acquisition Trend
A summary widget shows a total number of certifications acquired by team members over the selected time frame. A trend widget shows the certification acquisition over time.
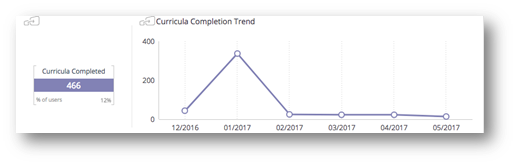
Curricula Completion Trend
A summary widget shows a total number of curricula completed by team members over the selected time frame. A trend widget shows curricula completed over time.
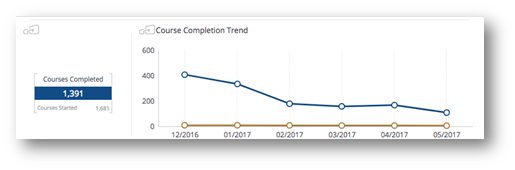
Course Completion Trend
A summary widget shows a total number of courses completed by team members over the selected time frame. The trend widget shows online (web-based) courses completed over time (blue line) and instructor led courses completed over time (gold line).
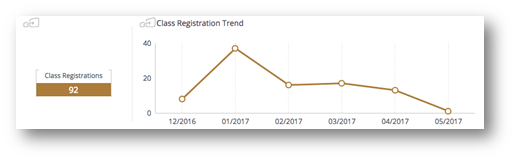
Class Registration Trend
A summary widget shows a total number of class (ILT) registrations for team members over the selected time frame. A trend widget shows the class (ILT) registrations over time.
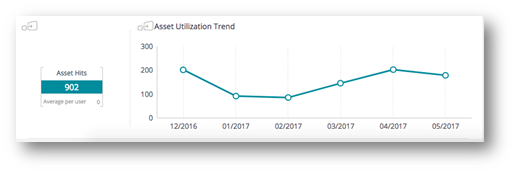
Asset Utilization Trend
An asset is any piece of content that is not a training object. Each time someone clicks on the asset, a “hit” is recorded. This section shows activity for asset hits.
A summary widget shows the total number of asset hits by team members over the selected time frame. A trend widget shows asset hits by team members over time.
Comments
0 comments
Article is closed for comments.